
Where Does Your Paycheck Actually Go?
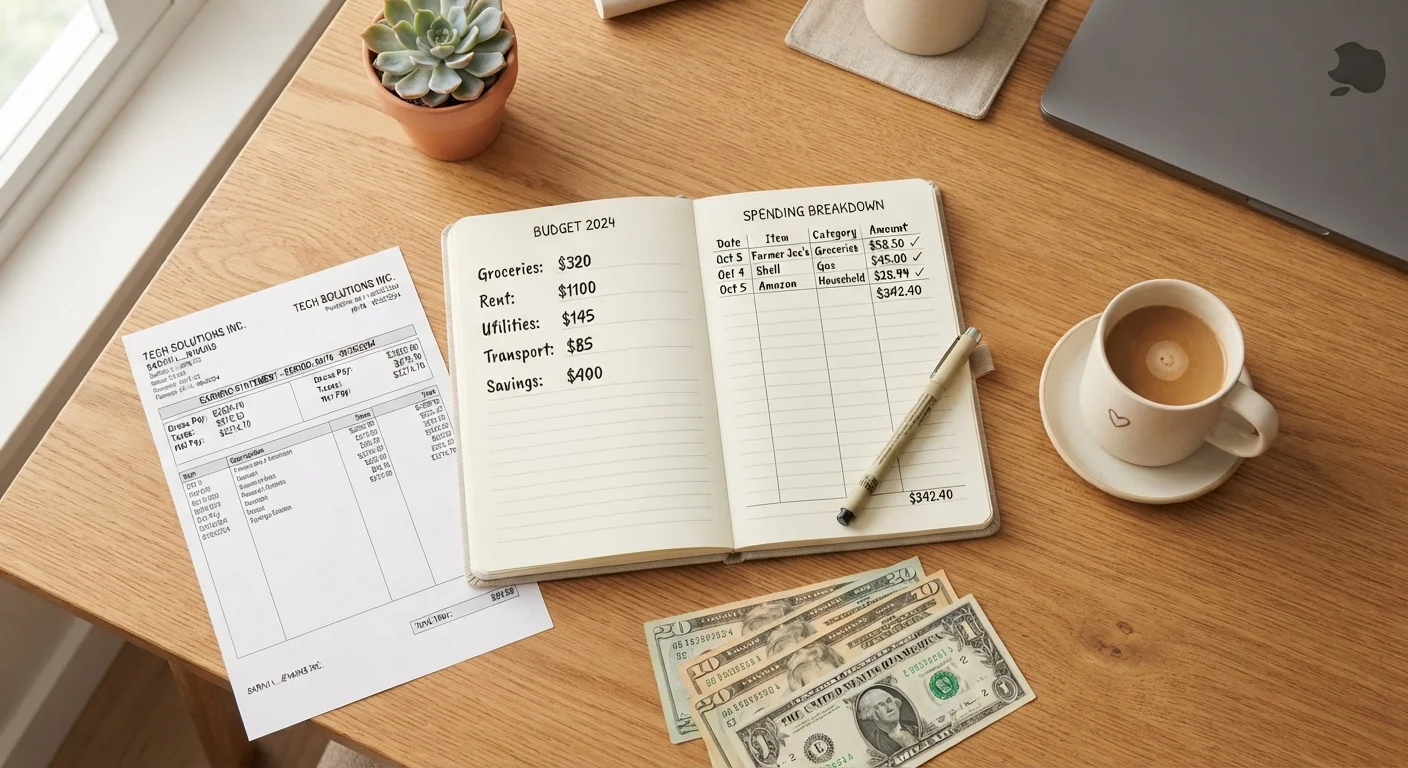
Photo credit: PrimeReads.net | Discover Insightful And Creative Blogs
In this article
A plain-language breakdown of how Americans typically allocate monthly income — and what the numbers reveal about everyday spending habits.
Key Takeaways
- Most Americans spend the largest share of their income on housing, often 30% or more.
- The gap between gross pay and take-home pay is significant - taxes and deductions reduce your check before you see it.
- Tracking spending by category reveals patterns that simple bank balance checks miss entirely.
- The 50/30/20 guideline is a starting framework, not a strict rule - your actual allocation will vary.
- Small recurring expenses can quietly consume a larger share of income than most people realize.
From Gross to Net: The First Deduction You Never Choose
Before a single dollar lands in your bank account, several deductions have already been made. Federal income tax, state income tax (where applicable), Social Security, and Medicare contributions are all withheld from your gross pay. Add employer-sponsored health insurance premiums or 401(k) contributions, and your actual take-home pay can be meaningfully lower than the salary figure on your offer letter.
For someone earning $60,000 a year, gross monthly pay is $5,000. After typical withholdings, take-home pay might realistically land between $3,600 and $4,200 depending on their tax situation, state, and benefits elections. That's the number that matters for budgeting. For a clear breakdown of the terms involved, see this glossary of personal budget terms.
The Typical Spending Breakdown - and What the Data Shows
According to the U.S. Bureau of Labor Statistics Consumer Expenditure Survey, American households generally allocate their spending across a consistent set of categories. Housing consistently claims the largest share - often 33% or more of after-tax income for many households. Transportation comes second, including car payments, fuel, insurance, and maintenance. Food, healthcare, and personal insurance follow.
33%
Average share of spending on housing
According to the U.S. Bureau of Labor Statistics Consumer Expenditure Survey, housing consistently represents the single largest category of household spending.
~16%
Average share spent on transportation
The BLS Consumer Expenditure Survey places transportation as the second-largest household expense category, covering vehicles, fuel, and transit.
~13%
Average share spent on food
Food spending (both at home and away from home) typically accounts for around 13% of total household expenditures, per BLS data.
What the averages don't show is the variation within each category. Housing costs differ dramatically between rural and urban households. Transportation costs spike for households without public transit access. These numbers are useful as benchmarks - not personal prescriptions. For a more detailed look at the categories most people forget to budget for, see spending categories every personal budget should include.
The 50/30/20 Framework: A Starting Point, Not a Finish Line
One of the most widely shared budgeting guidelines divides net income into three broad buckets: roughly 50% toward needs (rent, utilities, groceries, minimum debt payments), 30% toward wants (dining out, subscriptions, entertainment), and 20% toward savings and additional debt repayment.
It's an accessible model because it doesn't require itemizing every transaction - just assigning spending to broad zones. But it's a framework, not a formula. Someone carrying high-interest debt may want to shift more toward repayment. Someone in an expensive metro may find 50% doesn't cover needs. The real value of the model is that it forces an honest look at whether spending reflects actual priorities. For a comparison of this and other approaches, see popular budgeting methods compared.
Audit One Month Before Budgeting Forward
Before building a new budget, review the last 30 days of actual bank and credit card transactions. Categorize each expense honestly. Most people discover at least one category - often food, subscriptions, or convenience spending - is significantly higher than they assumed. Real spending data is a far more reliable starting point than estimates.
What Most People Don't Track - and Why It Matters
Recurring monthly expenses like rent and utilities are easy to track. The harder ones are irregular costs - annual software subscriptions, semi-annual car insurance payments, seasonal spending, and unexpected medical expenses. These tend to fall outside of monthly budget estimates, creating the familiar feeling of a month that "went wrong" without any obvious single cause.
Another common blind spot: small, high-frequency spending. Daily coffee, convenience store stops, and impulse app purchases each feel trivial in isolation. Aggregated over a month, they often total more than a single large discretionary expense most people would deliberate over carefully.
If your income varies month to month, these challenges compound. Budgeting strategies for freelancers and gig workers address a different set of needs than standard paycheck-based advice.
Once you understand where your money currently goes, the next step is building a plan designed to actually hold up. Building a monthly budget that works in real life walks through how to do that in practical terms.
This article is for general informational and educational purposes only and does not constitute personalized financial advice. Consult a qualified financial professional for guidance specific to your situation.
Frequently Asked Questions

Author
Money Editorial Team
Money Editorial Team is the collective byline for our editorial team and contributor network. Articles published under this byline or an editorial pen name are researched, written, and reviewed according to our editorial standards for clarity, consistency, and independence before publication.
View all articles →